Empty Pipes
Multi-Page Vertically Centered Latex Table
Say we wanted to create a latex table that had vertically centered text. Say furthermore that our table was very long and we wanted it to automatically span multiple pages.
Then we might imagine that the table would have a heading…
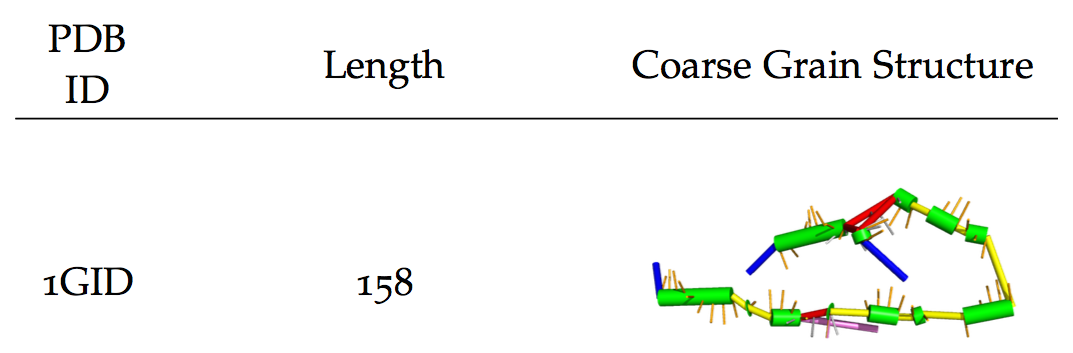
Followed by an ending at the end of the page…
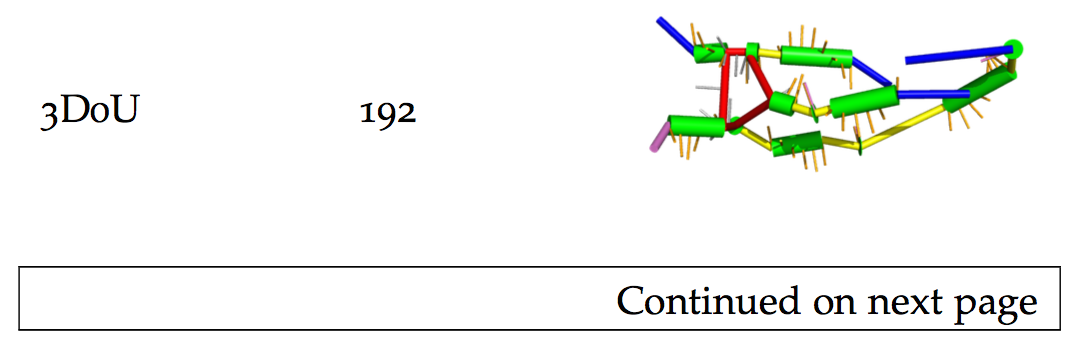
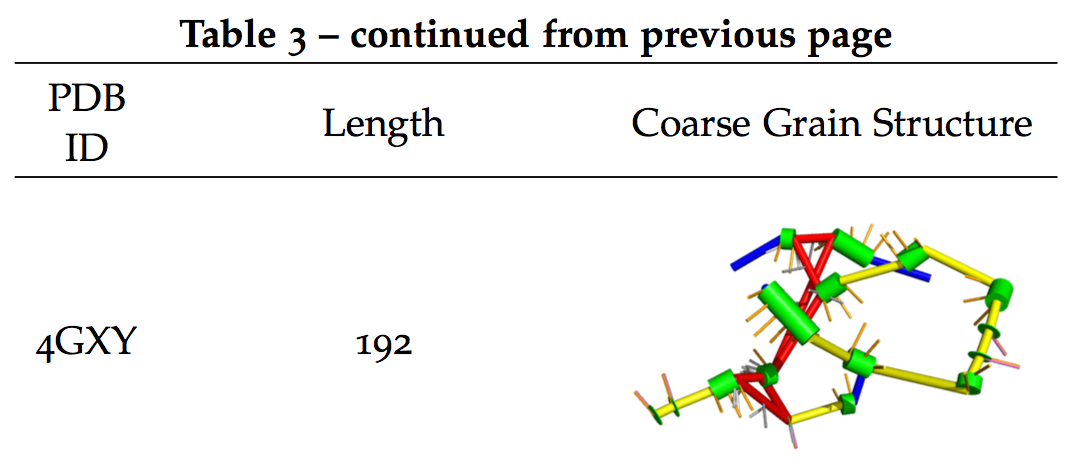
Which would be continued at the start of the next page…
Such a table can be created using the snippet of code below. It uses the
array package for vertically centering the cell text and the longtable
package for automatically breaking up the table across multiple pages.
\usepackage{array}
\usepackage{longtable}

\begin{longtable}{ >{\centering\arraybackslash} m{1cm} >{\centering\arraybackslash} m{4cm} >{\centering\arraybackslash} m{4cm}}
PDB ID & Length & Coarse Grain Structure \\
\hline
\endfirsthead

\multicolumn{3}{c}%
{ {\bfseries \tablename\ \thetable{} -- continued from previous page} } \\
\hline PDB ID & Length & Coarse Grain Structure \\
\hline
\endhead

\hline \multicolumn{3}{|r|} \\ \hline
\endfoot

\hline \hline
\endlastfoot
1GID & 158 & \includegraphics[width=4cm]{gfx/cgs/1GID_A.png} \\
3D0U & 192 & \includegraphics[width=4cm]{gfx/cgs/3D0U_A.png} \\
4GXY & 192 & \includegraphics[width=4cm]{gfx/cgs/4GXY_A.png} \\
\end{longtable}
Stack Exchange References:
Randomly Finding Someone on a Grid
A few months ago somebody asked the following question on AskReddit:
“If I wanted to randomly find someone in an amusement park, would my odds of finding them be greater if I stood still or roamed around?”
As usual, the comments were highly informative with various users running simulations to show that two people would generally find each other faster when both moved around. The question was lost in the detritus of my mind until a recent late-night conversation after a bioinformatics conference. The context in this conversation was different but the underlying question was the same.
“Are two proteins more likely to encounter each other when both are mobile or when one is attached to a cell membrance while the other is free to float around the interior of the cell?”
After bringing up the reddit post, I tried my best to explain why it would make sense that fixing the position of one person (or protein) would make it easier for the other to find it.
Alas, my memory had failed me and this conclusion was contrary to that suggested by the reddit comment simulations. What struck me, however, is that I couldn’t make a coherent case for why standing still is better, and wasn’t convinced by the other’s argument that moving around was better. Frustrated, I decided to make a little tool to perform a simulation of my own and to illustrate the phenomenon. So, without further ado, here we go.
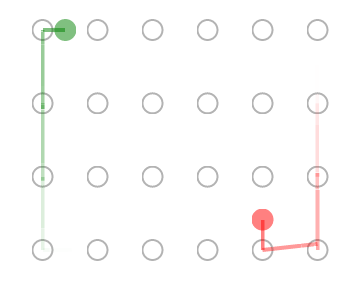
Scenario 1: One person waits
One person (green circle) waits, while the other (red circle) searches. Both start at random positions at the start of each simulation.
Scenario 2: Both people move
Both people (green and red circles) move around. Both start at random positions at the start of each simulation.
Verdict
To save you some time, I took the liberty of repeating these simulations for a variety of grid sizes and recorded the results.
Number of Moves Required to Meet
| Grid Size | Both People | One Person |
|---|---|---|
| Moving | Waits | |
| 2x2 | 2 | 2 |
| 4x4 | 11 | 14 |
| 8x8 | 53 | 73 |
| 16x16 | 257 | 453 |
It’s clear that the better strategy is for both people to move at random than to have one person wait while the other moves randomly.
But wait…
Is this really a realistic scenario? How often do people just move around randomly? In most cases, when people are looking for something, they search in some methodic manner. The rest of this post will explore two fundamentally similar strategies and how they affect the search time.
Scanning Strategy
The first strategy involves simply scanning the grid up and down, left to right.
Avoiding Strategy
The avoiding strategy involves keeping track of where the person has been, and at every point, visiting the least visited neighbor. If there is more than one least visited neighbor, pick one at random and continue.
Centering Strategy
A reddit user recently pointed out that a reasonable strategy might be for one person to just go to the center because there they would have a larger chance of being found by randomly moving person. An illustration of this appears below where the red person moves to the center and green person wanders around randomly.
Pairwise Comparison of Strategies
To determine what the best course of action is when two people are separated somewhere, we need to do a pairwise comparison of the strategies on an 8x8 grid:
Median Moves Requires to Meet
| Standing | Random | Scanning | Avoiding | Centering | |
| Standing | * | 82 | 34 | 33 | * |
| Random | 60 | 51 | 51 | 54 | |
| Scanning | * | 52 | 15 | ||
| Avoiding | 57 | 30 | |||
| Centering | 3 |
Generally, standing still is the best strategy if the other person is not moving around randomly. Even if they are, the best strategy appears to be to first go the center and stay put there. Moving around randomly is only optimal if the other person is doing an avoiding walk. Scanning and avoiding work well in general with one major caveat: if both people are scanning, it can lead to a situation where the two peole never meet, no matter how long they walk.
The avoiding strategy avoids (heh), this outcome by introducing a little bit of stochasticity into the searching process by picking a random position to go to when there are equally many least visited options available.
Conclusion
The best strategy is for people to choose a point at which they meet if they get lost. When both people go to the center, it takes a median of 3 moves and will never take more than four moves (on an 8x8 grid).
Often times, however, this doesn’t enter the conversation and an ad-hoc strategy must be selected. The second best option is for one person to stop moving and for the other to scan the search area looking for them. This also requires a certain amount of prior coordination to determine who will stop. If both people decide to stop, then it stands to reason that they’ll never find each other. Thus, when there is no agreed upon strategy, it appears that the best choice is to walk around avoiding places that you’ve already been and taking a random turn here or there.
Finally, if you’re really lazy it pays off to walk to the center and wait there. This will actually lead to a faster rendezvous when the other person is walking around randomly than walking around randomly yourself.
Good luck!
Read on for a look at the distributions of finding times and the application that made all of this possible.
Appendix
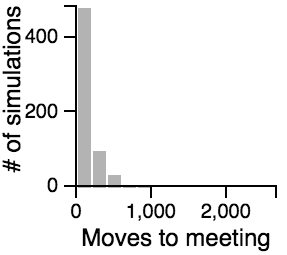
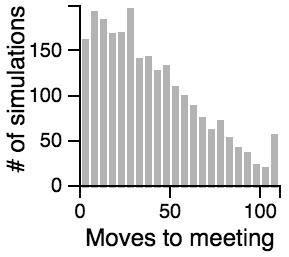
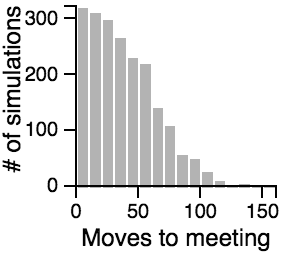
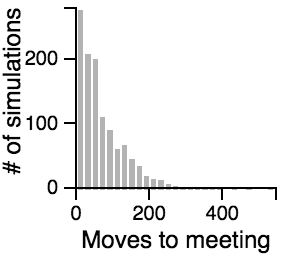
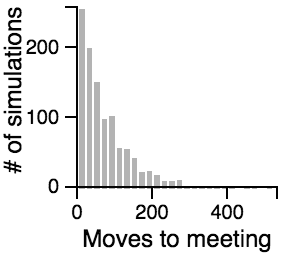
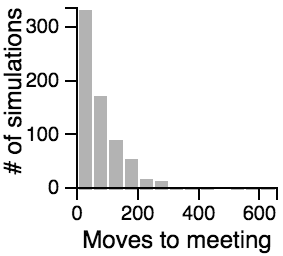
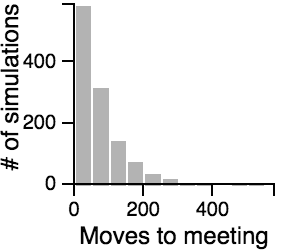
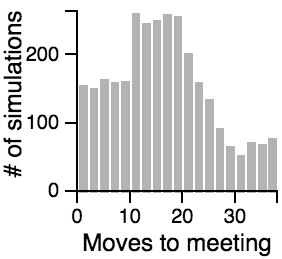
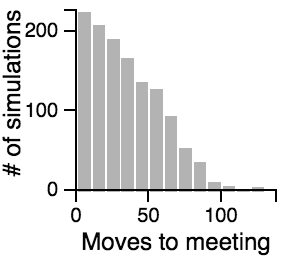
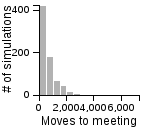
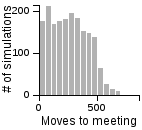
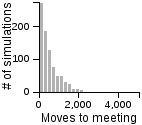
The Distribution of the Number of Moves Required to Meet
| Standing | Random | Scanning | Avoiding | Centering | |
| Standing |  |
 |
 |
 |
|
| Random | 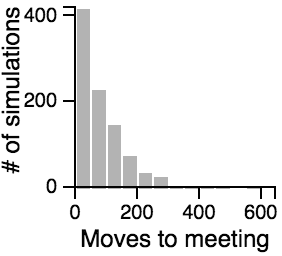 |
 |
 |
 |
|
| Scanning | |
 |
 |
||
| Avoiding | 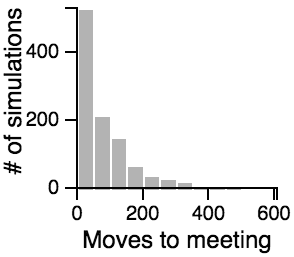 |
 |
|||
| Centering | 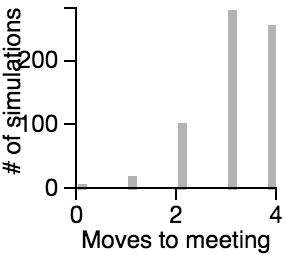 |
Key Points from the Histograms:
- Having one person sit still severly restricts the maximum number of moves that need to be taken if the other person is using the avoiding or scanning strategy.
- One person standing and the other moving randomly can lead to an exorbitantly long search time.
- Both people standing or both people scanning can lead to infinite search times.
- Most of the time, the search will be faster rather than slower, but the times can vary a lot. Much of the bias toward faster search times is actually due to the fact that the starting points are chosen randomly, and closer starting points are more likely than further starting points.
In Three Dimensions
A few people wondered how different the results would be on a 3D grid. It’s large-ish step to add 3D rendering to the current animations, but changing the code to use 3D dimensions wasn’t a huge deal. The results are in the table below.
Median Moves Requires to Meet
| Standing | Random | Avoiding | |
| Standing | * | 438 | 253 |
| Random | 380 | 375 | |
| Avoiding | 344 |
The results a roughly analagous to those on the 2D grid. Naturally, it takes more moves for people to find each other in 3D, but the best strategy remains standing - avoiding, and moving in a random fashion is better than standing when the other person is also moving randomly. For those that are interested, the histograms below show the distribution of search lengths on a 3D grid.
The Distribution of the Number of Moves Required to Meet on a 3D Grid
| Standing | Random | Avoiding | |
| Standing | |
 |
 |
| Random | 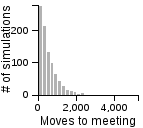 |
 |
|
| Avoiding | 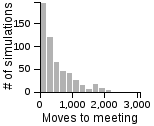 |
Make Your Own Simulation
Here’s an application that you can use to run your own simulation.
Source
The source code for the application to run these simulations can be found on github.
D3.js and Contouring
Contouring is an important way for displying 3D data in 2D. At its core are iso-lines, along which values in the third-dimension have equal values, and iso-bands which are areas that encompasse values within some range (e.g. greater than 2 and less than 10). It is used for anything from topographical maps to show lines of equal elevation, weather maps to show regions of equal pressure to probability density plots to show regions with equal probability density. Calculating iso-lines and iso-bands is often done by interpolating values on a grid.
From a practical standpoint, there appear to be 3 javascript libraries capable of calculating iso-lines and iso-bands, MarchingSquares.js, conrec.js and Turf.js. The table below shows an overview of the three different implementations and is followed by a slightly more thorough explanation of their strengths and weaknesses.
MarchingSquares.js |
Conrec.js |
Turf.js |
|
Pros: Simple. Adds contours to the edges of the data. True
iso-band support. |
Pros: Options for specifying x- and y- values. | Pros: Interpolates the input data. Works with GeoJSON data structures. |
| Cons: Works only on gridded data. No option for specifying x- and y- values. | Cons: Works only on gridded data. Doesn't return true iso-bands. Requires a extra values to draw a border. | Cons: Interpolates the input data (can cause distortions). Works with GeoJSON data structures. Doesn't return actual iso-bands. |
MarchingSquares.js uses the eponymous
algorithm to calculate both iso-lines and iso-bands. Conrec.js uses a slightly
different algorithm and returns iso-lines, whereas Turf.js appears to use the
conrec algorithm to generate iso-lines. The examples above used the following
data set. The breaks indicates where we want the iso-lines, and the iso-regions should
correspond to areas between adjacent breaks.
    var breaks = [0, 4.5, 9, 13.5, 18];
    var data = [[18, 13, 10, 9, 10, 13, 18],
        [13, 8, 5, 4, 5, 8, 13],
        [10, 5, 2, 1, 2, 5, 10],
        [9, 4, 1, 12, 1, 4, 9],
        [10, 5, 2, 1, 2, 5, 10],
        [13, 8, 5, 4, 5, 8, 13],
        [18, 13, 10, 9, 10, 13, 18],
        [18, 13, 10, 9, 10, 13, 18]];
MarchingSquares.js accurately returns is iso-bands and draws the plot as expected. Each path corresponds to a particular region. Thus hovering over the middle section also highlights the outer section which corresponds to the same values (13.5 - 18).
Conrec.js correctly outlines the regions, but the level returned for the second and third sections from the middle is the same although they should correspond to different iso-bands. To create the plot, it was also necessary to add some artifically high values along the outside boundaries so that iso-lines were drawn around the edges.
Turf.js interpolated the data onto another grid and drew iso-lines in the same manner as conrec.js. The automatic interpolation is listed in the table as both a pro and a con because it can be useful when the data is not already on a grid, but deleterious when it insists on using a uniform resolution on both the x and y scales and re-interpolating already gridded data (as in the example above).
Needless to say, of the three methods, MarchingSquares.js was the easiest and most aesthetically pleasing to me so I will likely use it in the future.
The code for all three of these examples can be found in a github repository here.
If you see any errors or omissions or know of a way to make the Turf.js example look more reasonable, please let me know on Twitter or by email.