Empty Pipes
Graph Proportions and Label Sizes
The example below shows how to create a graph that is both aesthetically
pleasing and sensibly proportioned. I used these parameters to generate the
majority of the figures in my PhD thesis. The savefig function can also be
used to save a pdf or an svg file for modification in your favorite image
editor (e.g. inkscape).
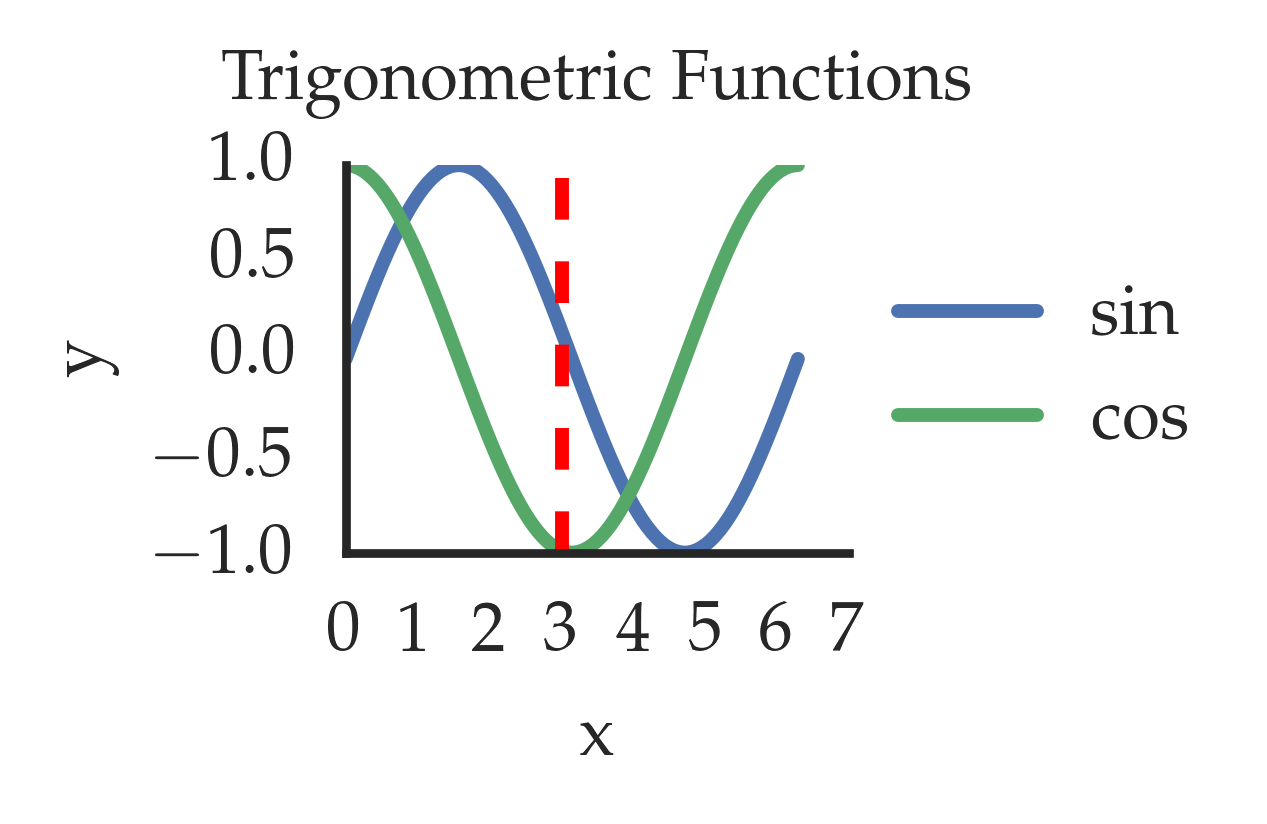
The code to generate this plot uses the seaborn library in an IPython notebook:
%load_ext autoreload
%autoreload 2
%pylab inline

import numpy as np
import seaborn as sns

rc('text', usetex=True)
plt.rc('font', family='Palatino')
sns.set_style('white')
sns.set_context("notebook", font_scale=1.0, rc={"lines.linewidth": 2})
rc('text', usetex=True)    # use latex in the labels
pylab.rcParams['figure.figsize'] = (1.3,1.0)


font = {'family' : 'serif',
        'serif': 'Palatino',
        'weight' : 'bold',
        'size'   : 11}

matplotlib.rc('font', **font)

# create the dummy data
x = np.linspace(0, 2*math.pi,100)
y = sin(x)
z = cos(x)

# plot that sucker
fig, ax = plt.subplots()
ax.plot(x, y, label='sin')
ax.plot(x, z, label='cos')

ax.set_xlabel('x')
ax.set_ylabel('y')
ax.axvline(x=3, color='red', ls='dashed')
ax.set_title('Trigonometric Functions', y=1.08)

ax.spines['right'].set_visible(False)
ax.spines['top'].set_visible(False)

pyplot.locator_params(nbins=7)
for item in ([ax.title, ax.xaxis.label, ax.yaxis.label] +
         ax.get_xticklabels() + ax.get_yticklabels()):
    item.set_fontsize(10)

handles, labels = ax.get_legend_handles_labels()
ax.legend(handles, labels, bbox_to_anchor=(1.8, 0.85))

plt.savefig('img/trigonometric_functions.png', dpi=500, bbox_inches="tight")