Empty Pipes
Layouts Upon Layouts
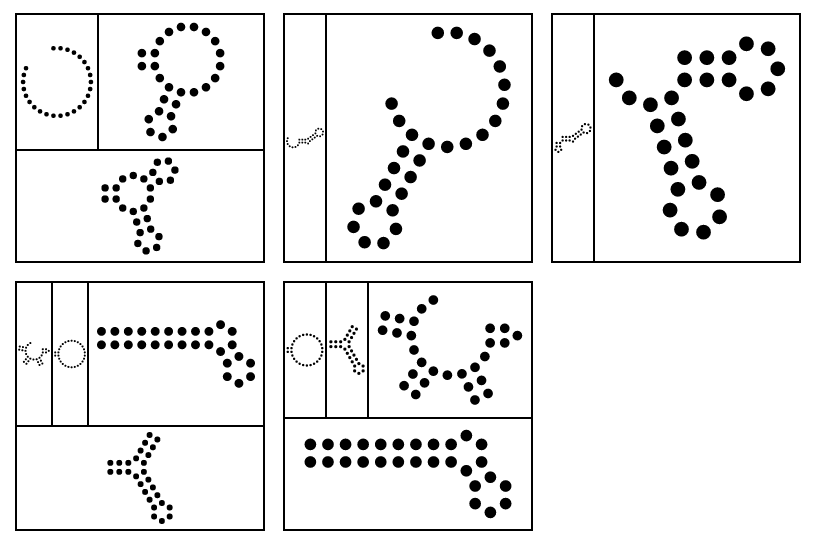
One of the truly beautiful things about d3.js is how easy it is to combine multiple layouts into one graphic. The example below incorporates three differents layout to show the data along 3 different dimensions:
-
RNA secondary structure. RNA is a molecule similar to DNA with the property that it folds back onto itself to form pairs with bases in its own sequence. Its secondary structure is often displayed as an eponymous diagram. The circles representing nucleotides are arranged using an rnaplot layout.
-
Some quantity associated with each molecule (e.g. concentration). We can display this by scaling the secondary structure diagrams using a treemap layout. Each rnaplot is scaled as a treemap
-
Multiples of the above quantities (e.g. from different experiments). Four sets of structures and sizes are arranged using a grid layout.
So how do we create this layout chaining? We start with the d3-grid layout:
var rnaTreemap = rnaTreemapChart()
var rectGrid = d3.layout.grid()

var rectData = rectGrid(root)
var gMain = d3.select(divName)
    .append('svg')
    .data(rectData)
    .enter()
    .append('g')
    ... //position the g according to rectData
    .call(rnaTreemap);
Now we have one appropriately positioned <g> for each treemap, under which we will construct the rna-treemap layout:
// the rna-treemap layout
var chart = function(selection) {
    selection.each(function(data) {
        var treemap = d3.layout.treemap()

        d3.select(this)
        .append('g'); //probably unnecessary
        .datum(data)
        .selectAll(".treemapNode")
        .data(treemap.nodes)
        .enter()
        .append('g')
        .call(rnaTreemapNode);

        function rnaTreemapNode(selection) {
            selection.each(function(d) {
                var chart = rnaPlot()

                if ('structure' in d) d3.select(this).call(chart)
            });
        }
    });
Finally, the rna-plot layout adds its own <g> and
continuous on drawing the circles associated with the RNA (not shown).
function chart(selection) {
    selection.each(function(data) {
        rg = new RNAGraph(data.sequence, data.structure,
                          data.name)

        d3.select(this)
        .append('g')
        ...
And that’s it! Create layout function. Create child nodes bound to the data. Call layout function. Rinse, repeat! Take a look at the “Towards Reusable Charts” tutorial for an excellent introduction to creating a custom layout.
Addendum
Here’s the beginning of the json file used to create the plot:
[{"name": "graph",
    "children": [{"structure": "((..((....)).(((....))).))",
        "sequence": "CGCUUCAUAUAAUCCUAAUGACCUAU",
        "size": 50},
        {"structure": "((...........(((....))).))",
            "sequence": "CGCUUCAUAUAAUCCUAAUGACCUAU",
            "size": 40},
            {"structure": "..........................",
                "sequence": "CGCUUCAUAUAAUCCUAAUGACCUAU",
                "size": 20}
    ]
},
{"name": "graph",
    "children": [{"structure": "...........(((((.....)))))..",
        "sequence": "CGCUUCAUAUAAUCCUAAUGACCUAU",
        "size": 50},
        {"structure": "(((((((......)))).))).......",
            "sequence": "CGCUUCAUAUAAUCCUAAUGACCUAU",
            "size": 10}
    ]
},
...]