Empty Pipes
Scaled Colormap in Matplotlib
I often have to create plots where the color of some element reflects an underlying value. This mapping of color -> value is generally easily accomplished by using colormaps in matplotlib. The standard provided colormaps (such as cm.jet or cm.cool) map values over the interval [0,1]. Often times, however, our data will have a different range and will need to be normalized in order for it to be mapped to the full range of available colors.
The example below illustrates what the color range looks like without the normalization (top two plots) and with the normalization (bottom plot).
import numpy as np
import matplotlib.cm as cm

# create two input value ranges
gradient1 = np.linspace(0, 1, 256)
gradient2 = np.linspace(-1, 1, 256)

# taken from matplotlib's very own colormap_referency.py example
#http://matplotlib.org/examples/color/colormaps_reference.html
fig, axes = plt.subplots(nrows=3, figsize=(5,1))
fig.subplots_adjust(top=0.95, bottom=0.01, left=0.2, right=0.99)

# plot the gradients given the colormaps
for g1,g2 in zip(gradient1, gradient2):
    # the first two are plotted without normalization
    # the input values are mapped directly to colors using cm.jet
    axes[0].axvline(g1, color=cm.jet(g1))
    axes[1].axvline(g2, color=cm.jet(g2))

    # add a normalizing function to map the input values to the range [0,1]
    # and then use that with ScalarMappable to get the appropriate colors
    norm = mpl.colors.Normalize(vmin=min(gradient2), vmax=max(gradient2))
    axes[2].axvline(g2, color=cm.ScalarMappable(norm=norm, cmap=cm.jet).to_rgba(g2))

# add the labels, also from:
#http://matplotlib.org/examples/color/colormaps_reference.html
for name, ax in zip(["[0,1]", "[-1,1]", "Normalized [-1,1]"], axes):
    pos = list(ax.get_position().bounds)
    x_text = pos[0] - 0.01
    y_text = pos[1] + pos[3]/2.
    fig.text(x_text, y_text, name, va='center', ha='right', fontsize=10)
    ax.set_axis_off()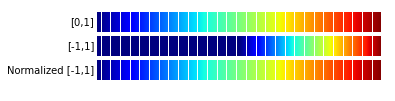
Notice how the unnormalized [-1,1] input values have a dark blue color over the
left half of the second plot. This is because cm.jet(-1) = cm.jet(-.5) =
cm.jet(0.) Values outside of cm.jet’s accepted input range of [0,1] all
return the same color. By using the Normalize class, the input values are
scaled to the [0,1] input range and the output colors span the entire range of
the colormap (third plot).